The Dos and Don’ts of Infographic Marketing
We all know that infographics are big online. They have been around for a while, but they have really taken off in the last few years. So much so, in fact, that many people are starting to wonder if it’s too saturated already. But is it? Of course not! Infographics should be used as often as possible because of the great benefits they offer businesses and consumers alike. However, there are dos and don’ts when using them correctly — read on to find out what you need to know about infographic marketing.
Table of Contents
The Dos
1. Use infographics to give consumers valuable information.
Infographics are great for giving the consumer something they can use in their daily life, whether it’s finding out how much time is wasted when you call customer service or what happens when you eat too many carrots.
The more that the infographic brings practical value to the person who views it, the more likely they are to share it. Additionally, if the infographic ties back into your brand or serves as a new way to promote your product or service, even better!
2. Produce infographics that are aesthetically pleasing.
If the information included on the infographic is valuable but looks terrible, no one will want to look at it. People want to view infographics that look good AND have practical value — so create one that hits both marks!
3. Make the infographic interactive.
If the infographic is easy to use, consumers are more likely to view it. So include hyperlinks or multiple-choice questions throughout for viewers to answer while they go through the graphic, adding even more value to the infographic! This works especially well if you want consumers to take some sort of action after they viewed it, be it signing up for your email list or clicking through to purchase a product.
4. Make infographics easy to share.
The best way to get people interested in viewing an infographic is by giving them many opportunities to share it with others. So include buttons at the top and bottom for people to easily do so and on the actual infographic whenever possible! The more that people can spread your content around, the better it is for you and your brand.
5. Get infographics designed by a professional designer.
Many marketers think they can just use PowerPoint or Photoshop to create an infographic, but this is not the best idea. You need infographics that are aesthetically pleasing and function well, so go with a professional designer who can get it done right and get it done quickly!
The Don’ts
1. Don’t overload the infographic with too much information.
This one may seem like a no-brainer, but it is very easy to get carried away when you’re writing an infographic. Do not, under any circumstances, use 10 different fonts and more than three colors in one infographic — this will make it look awful!
The more information that’s included, the harder it is for people to read and process what it is saying, no matter how pretty it looks. Keep the design clean and to the point while using only one or two fonts and a couple of colors to make an effective infographic that consumers will read and share!
2. Don’t use large blocks of text.
The best infographics are made up entirely of visuals, so do not include any large blocks of text. If you do, people will not read it and the infographic’s message will be lost. Rather than including long chunks of text, create a separate page for the details that you can link to at the bottom of the main graphic as an added resource.
3. Don’t put too much information on social media buttons.
Many people think that the more places they include a social media button, the better. However, this is not true! When you put too many buttons on the graphic, it looks cluttered and tacky — try to keep it simple with just one or two of your most widely used sites. The more you have on there, the fewer people will actually use the links!
One good tip when making infographics is to use Venngage – a free infographic maker that offers a wide range of the best infographics. Here are some cool infographic examples from their website!
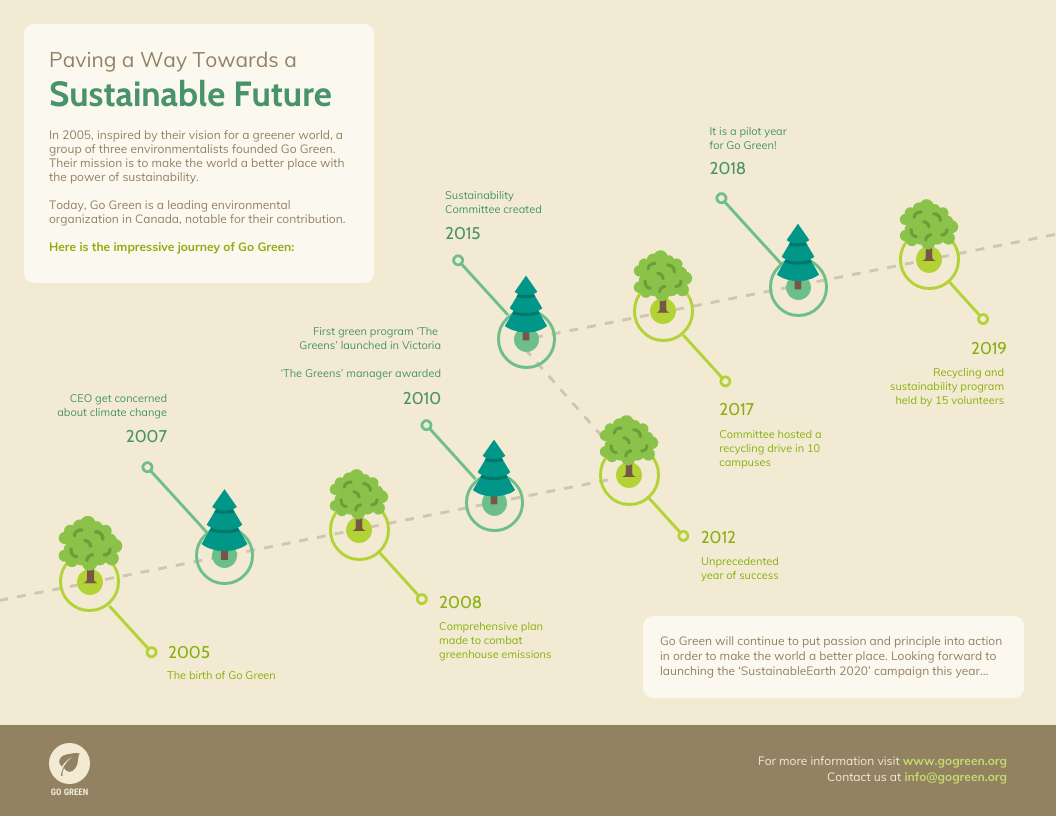
Venngage
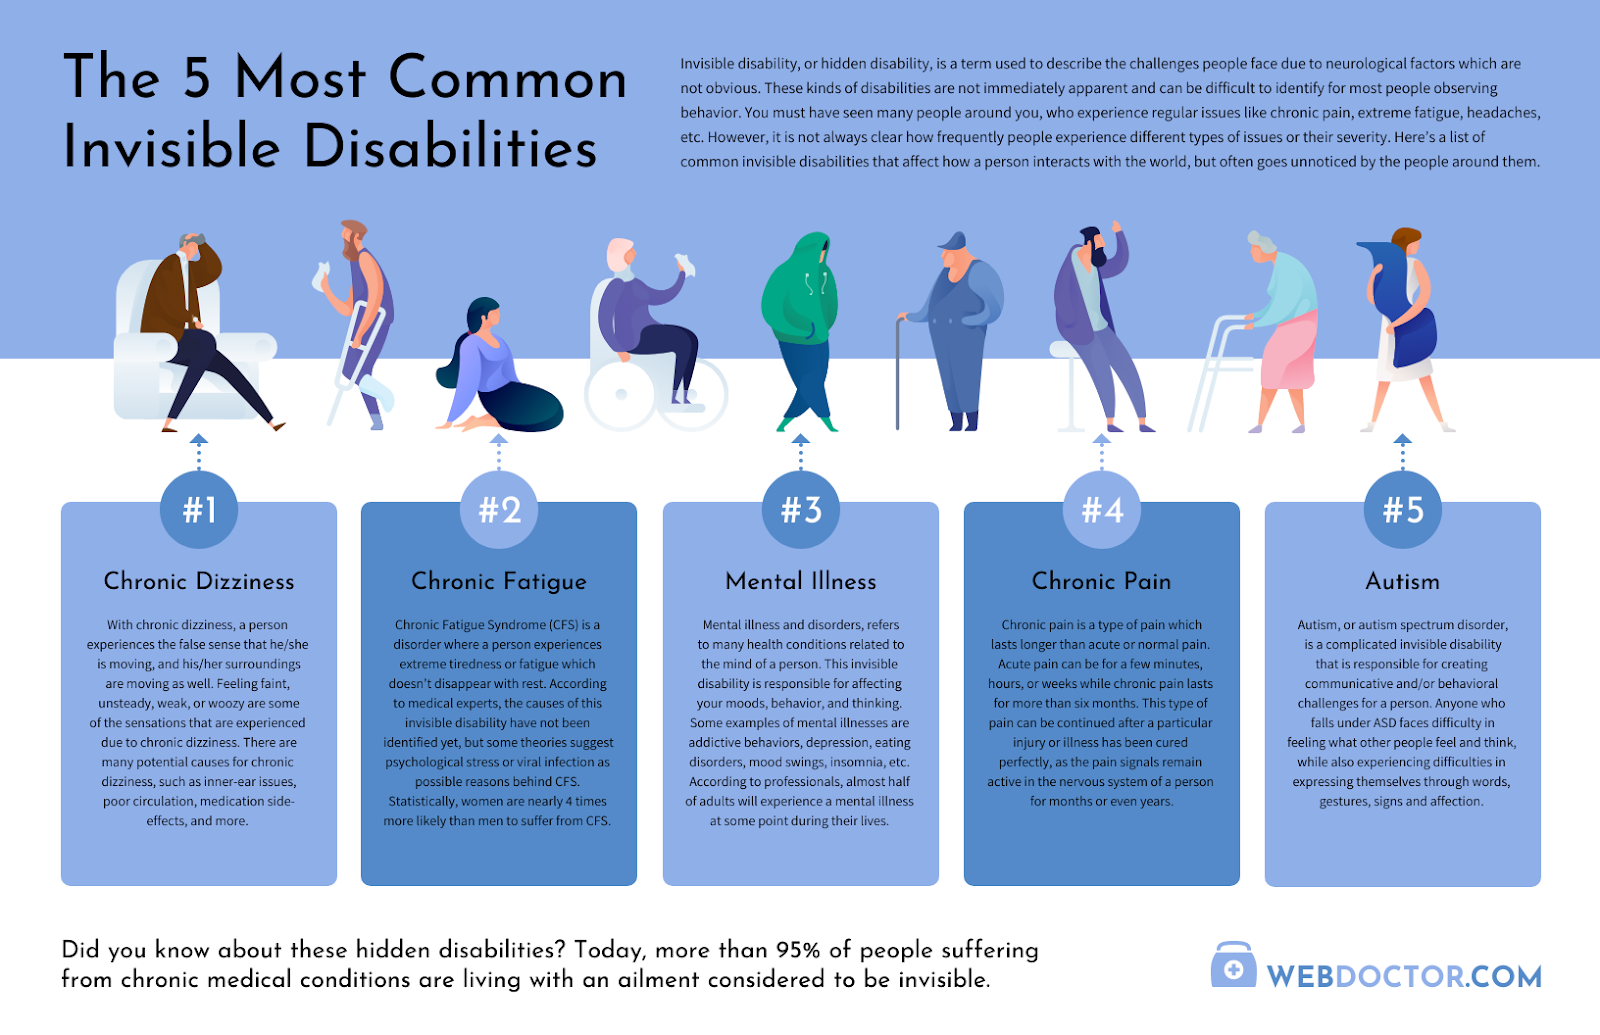
Venngage
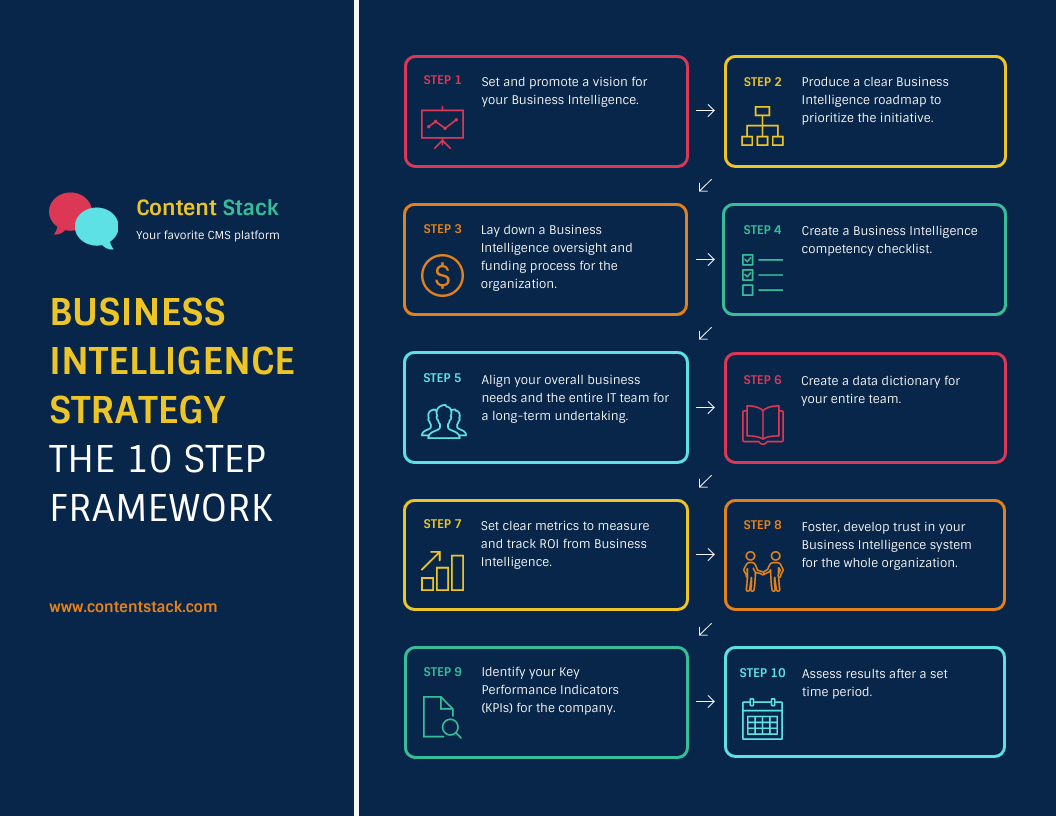
Venngage
Infographics are a great way to get your content out there, but they must be done right in order to make an impact on consumers. Follow these guidelines and make use of Venngage infographics to create an effective visual that will generate shares and views! To start, click here.
Follow techwaver for more!